University of Florida Homepage

“Perception bias”: Deciphering a mismatch between urban crime and perception of safety


New article first published online: Landscape and Urban Planning; DOI: 10.1016/j.landurbplan.2020.104003

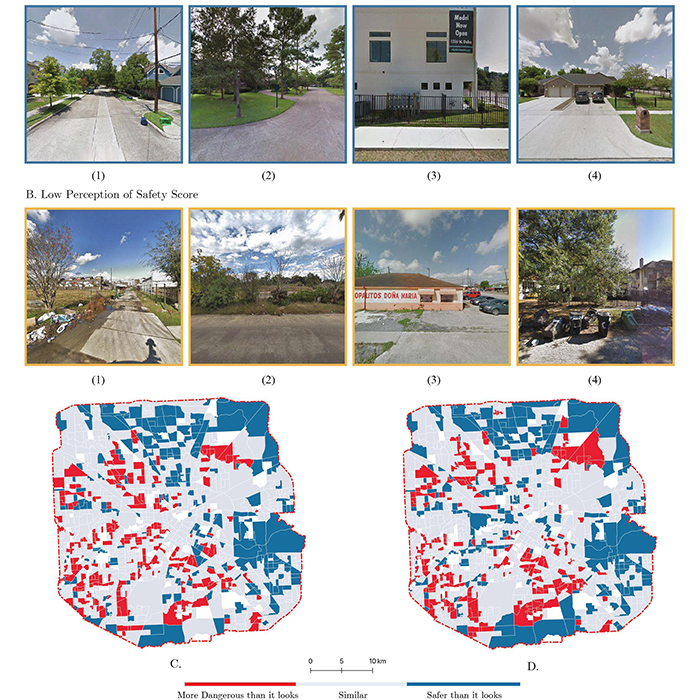
ABSTRACT: Crime and perception of safety are two intertwined concepts affecting the quality of life and the economic development of a society. However, few studies have quantitatively examined the difference between the two due to the lack of granular data documenting public perceptions in a given geographic context. Here, by applying a pre-trained scene understanding algorithm, we infer the perception of safety score of streetscapes for census block groups in the city of Houston using a large number of Google Street View images. Then, using this inferred perception of safety, we create “perception bias” categories for each census block group. These categories capture the level of mismatch between people’s visually perceived safety and the actual crime rates. This measure provides scalable guidance in deciphering the relationship between the built environment and crime. Finally, we construct a series of models to examine the “perception bias” with static and dynamic urban factors, including socioeconomic features (e.g., unemployment rate and ethnic compositions), urban diversity (e.g., number and diversity of Points of Interest), and urban livelihood (i.e., hourly count of visitors). Analytical and numerical results suggest that the association between characteristics of urban space and “perception bias” over crime could be paradoxical. On the one hand, neighborhoods with a higher volume of day-time visitors appear more likely to be safer than it looks (low crime rate and low safety score). On the other hand, those with a higher volume of night-time visitors are likely to be more dangerous than it looks (high crime rate). The findings add further knowledge to the long-recognized relationship between built environment and crime as well as highlight the perception of safety in cities, which in turn enhances our capacity to design urban management strategies that prevent the emergence of extreme “perception bias”.

Read the full publication at Landscape and Urban Planning

Dr. Yujie Hu presented at UFII COVID-19 SEED Awardees Virtual Seminar Series

Dr. Yujie Hu was invited by UF Informatics Institute to present some preliminary findings from his funded project examining the impacts of COVID-19 on crime patterns.

Refer to this link for a brief summary of the results and this link for his presentation.

Temporal dynamics of the impact of land use on modal disparity in commuting efficiency


New article first published online: Computers, Environment and Urban Systems; DOI: 10.1016/j.compenvurbsys.2020.101523

ABSTRACT: Urban land use is known to affect commuting efficiency according to the excess commuting framework. However, most studies do not include temporal dynamics, and those that do, focus on decadal, yearly, or daily temporal resolutions. However, commuting is not a stationary spatial process. Since people leave home and start their jobs at different times of the day and since traffic congestion varies throughout the day, neglecting hourly dynamics can misestimate commuting efficiency in a region and lead to erroneous policy implications. Another important issue often overlooked in the past is the modal disparity in commuting efficiency and how it evolves during the day. To overcome these limitations, this research examines the commuting efficiency variation by car and public transport by six one-hour periods between 5 AM and 11 AM in Warsaw, Poland, using travel survey data and travel times generated from GPS-based big data for cars and from GTFS for public transport. We develop four different groups of modeling scenarios: no disaggregation, disaggregation by time, disaggregation by mode, and disaggregation by time and mode. Therefore, excess commuting and modal disparity metrics are applied for a total of 21 specific time and mode combinations. The results suggest that commuting efficiency is worst during the 8–9 AM period for both modes, and that public transport users are more efficient after 7 AM. Hourly variations in the excess commuting metrics imply that policy makers should examine ways to encourage flexible work hours to distribute work starts and to increase public transport frequencies in the off-peak.

Read the full publication at Computers, Environment and Urban Systems

Read the preprint pdf at ResearchGate

A tale of two cities: Jobs–housing balance and urban spatial structures from the perspective of transit commuters


New article first published online: Environment and Planning B: Urban Analytics and City Science; DOI: 10.1177/2399808320938803

ABSTRACT: The jobs–housing balance and urban spatial structure are naturally connected, and understanding the connection is important for urban planning, geography, and transport studies. Using smartcard data in Beijing and Shanghai, this research employs a comparative approach to reveal spatial distribution patterns of jobs–housing balance in terms of transit commuters and derive the implied urban spatial structures for the two megacities in China. Results suggested that (1) the overall job–resident ratios estimated with smartcard data were 1.97 and 2.47 in Shanghai and Beijing, respectively; (2) compared to Beijing, Shanghai had greater intermixing of jobs and housing; (3) Beijing’s urban form followed a concentric spatial structure, whereas Shanghai followed a quasi-sector configuration. These findings show that the job–resident ratio can be used as an indicator to capture land-use patterns or functional zones, which is useful for urban planning and transit network design.

Read the full publication at Environment and Planning B: Urban Analytics and City Science

Read the preprint pdf at ResearchGate

Meet the Geographer: Dr. Yujie Hu

Dr. Yujie Hu was recently interviewed by UF Geography Department about how he got interested in Transportation Geography, networks, and GIS! Thanks to Mike Simonovich for interviewing!

Refer to this link for more detail.

Estimating a large drive time matrix between ZIP codes in the United States: A differential sampling approach


New article first published online: Journal of Transport Geography; DOI: 10.1016/j.jtrangeo.2020.102770

ABSTRACT: Estimating a massive drive time matrix between locations is a practical but challenging task. The challenges include availability of reliable road network (including traffic) data, programming expertise, and access to high-performance computing resources. This research proposes a method for estimating a nationwide drive time matrix between ZIP code areas in the U.S.—a geographic unit at which many national datasets including health information are compiled and distributed. The method (1) does not rely on intensive efforts in data preparation or access to advanced computing resources, (2) uses algorithms of varying complexity and computational time to estimate drive times of different trip lengths, and (3) accounts for both interzonal and intrazonal drive times. The core design samples ZIP code pairs with various intensities according to trip lengths and derives the drive times via Google Maps API, and the Google times are then used to adjust and improve some primitive estimates of drive times with low computational costs. The result provides a valuable resource for researchers.

Read the full publication at Journal of Transport Geography

Read the preprint pdf at ResearchGate

Dr. Yujie Hu awarded the UFII COVID-19 Response SEED Funding

Dr. Yujie Hu is awarded the COVID-19 Response SEED Funding from UFII (UF Informatics Institute). This competitive research award provides seed money for applications for data science, machine learning, AI, and mathematical modeling related research that can be rapidly mobilized to help address various facets of the COVID-19 pandemic.

Dr. Hu and his collaborator will be examining the impacts of the COVID-19 pandemic on crimes. His team is looking for two student OPS positions (undergrad or grad) to contribute to this project. Refer to this link for more detail about the positions and how to apply.

Accessibility and transportation equity

New editorial published online: Sustainability; DOI: 10.3390/su12093611

In this introduction to the Special Issue of Sustainability on accessibility and equity in transportation, we attempt to synthesize key lessons from the issue’s fifteen substantive articles. These involve accessibility-related lessons including accessibility improvement in railways; optimizations of cross-border road accessibility, intercity networks, and pedestrian access to public transportation; as well as various aspects in urban transportation planning such as urban mobility, integration of bike-sharing, and electronically powered personal mobility vehicles. Other lessons cover equity-related aspects of transportation including the provision of the maximally full information to underserved populations to lessen the burden of unequitable access to urban facilities, ensuring socially equitable transportation planning and reducing burdens in commuting cost among low-income commuters. Finally, remaining lessons link equity back to accessibility with discussions on accessibility to public transport for disabled as well as visually impaired people, and equitable job access by poor commuters.

Read the full publication at Sustainability.

Estimating road network accessibility during a hurricane evacuation: A case study of hurricane Irma in Florida


New article first published online: Transportation Research Part D: Transport and Environment; DOI: 10.1016/j.trd.2020.102334

ABSTRACT: Understanding the spatio-temporal road network accessibility during a hurricane evacuation—the level of ease of residents in an area in reaching evacuation destination sites through the road network—is a critical component of emergency management. While many studies have attempted to measure road accessibility (either in the scope of evacuation or beyond), few have considered both dynamic evacuation demand and characteristics of a hurricane. This study proposes a methodological framework to achieve this goal. In an interval of every six hours, the method first estimates the evacuation demand in terms of number of vehicles per household in each county subdivision (sub-county) by considering the hurricane’s wind radius and track. The closest facility analysis is then employed to model evacuees’ route choices towards the predefined evacuation destinations. The potential crowdedness index (PCI), a metric capturing the level of crowdedness of each road segment, is then computed by coupling the estimated evacuation demand and route choices. Finally, the road accessibility of each sub-county is measured by calculating the reciprocal of the sum of PCI values of corresponding roads connecting evacuees from the sub-county to the designated destinations. The method is applied to the entire state of Florida during Hurricane Irma in September 2017. Results show that I-75 and I-95 northbound have a high level of congestion, and sub-counties along the northbound I-95 suffer from the worst road accessibility. In addition, this research performs a sensitivity analysis for examining the impacts of different choices of behavioral response curves on accessibility results.

Read the full publication at Transportation Research Part D: Transport and Environment

Read the preprint pdf at ResearchGate

Automated delineation of cancer service areas in northeast region of the united states: a network optimization approach


New article first published online: Spatial and Spatio-temporal Epidemiology; DOI: 10.1016/j.sste.2020.100338

ABSTRACT:

Objective
Derivation of service areas is an important methodology for evaluating healthcare variation, which can be refined to more robust, condition-specific, and empirically-based automated regions, using cancer service areas as an exemplar.

Data sources/study setting
Medicare claims (2014–2015) for the nine-state Northeast region were used to develop a ZIP-code-level origin-destination matrix for cancer services (surgery, chemotherapy, and radiation). This population-based study followed a utilization-based approach to delineate cancer service areas (CSAs) to develop and test an improved methodology for small area analyses.

Data collection/extraction methods
Using the cancer service origin-destination matrix, we estimated travel time between all ZIP-code pairs, and applied a community detection method to delineate CSAs, which were tested for localization, modularity, and compactness, and compared to existing service areas.

Principal findings
Delineating 17 CSAs in the Northeast yielded optimal parameters, with a mean localization index (LI) of 0.88 (min: 0.60, max: 0.98), compared to the 43 Hospital Referral Regions (HRR) in the region (mean LI: 0.68; min: 0.18, max: 0.97). Modularity and compactness were similarly improved for CSAs vs. HRRs.

Conclusions
Deriving cancer-specific service areas with an automated algorithm that uses empirical and network methods showed improved performance on geographic measures compared to more general, hospital-based service areas.

Read the full publication at Spatial and Spatio-temporal Epidemiology